The Node.js Debug Module: Advanced Usage
Originally published at StrongBlogIn a previous post, I mentioned having used the debug module to help me understand some complex interactions between events in Leaflet & Leaflet.Editable. Before we go over that, however, let's lay the groundwork with a couple organizational tips that makes debug easier to use. This post assumes you have either used debug or read the previous post, so please do one of those first!
Namespacing Debug Functions
The debug module has a great namespacing feature which allows you to enable or disable debug functions in groups. It is very simple-- namespaces are separated by colons:
debug('app:meta')('config loaded')
debug('app:database')('querying db...');
debug('app:database')('got results!', results);
Enable debug functions in Node by passing the name the process via the DEBUG environment variable. The following would enable the database debug function but not meta:
$ DEBUG='app:database' node app.js
To enable both, list both names, comma separated:
$ DEBUG='app:database,app:meta' node app.js
Alternately, use a "splat" (*) to enable any debugger in that namespace. The following enables any debug function whose name starts with app::
$ DEBUG='app:*' node app.js
You can get as granular as you want with debug namespaces...
debug('myapp:thirdparty:identica:auth')('success!');
debug('myapp:thirdparty:twitter:auth')('success!');
...but don't overdo it. Personally, I try not to go deeper than two or sometimes three levels.
More Namespace Tricks
The "splat" character * can match a namespace at any level when enabling a debug function. Given the two debug functions above above, you can enable both thus:
$ DEBUG='myapp:thirdparty:*:auth' node app.js
The * here will match identica, twitter, or any other string.
It's frequently useful to enable all debug functions in a namespace with the exception of one or two. Let's assume we have separate debug functions for each HTTP status code that our app response with (a weird use of debug, but why not!):
const OK = debug('HTTP:200');
const MOVED = debug('HTTP:301');
const FOUND = debug('HTTP:302');
const UNAUTHORIZED = debug('HTTP:403');
const NOTFOUND = debug('HTTP:404');
// etc.
We can turn them all on with HTTP:*, but it turns out that 200 comes up way too frequently so we want it turned off. The - prefix operator can be used to explicitly disable a single debugger. Here, we'll enable all debuggers in this namespace then disable just HTTP:200:
$ DEBUG='HTTP:*,-HTTP:200' node app.js
Externalizing Debug Functions
debug() is factory function, and when you call it it returns another function, which can be called to actually write to the console (more specifically, STDERR in Node.js):
debug('abc');        // creates function, doesn't write anything
debug('foo')('bar'); // writes `foo: bar` (assuming that debugger is enabled)
If we want to reuse this debugger, we can assign the function to a variable:
var fooLogger = debug('foo');

fooLogger('bar');                    // writes `foo: bar`
fooLogger('opening pod bay door...') // writes `foo: opening pod bay door...`
While it's easy to create one-off debug functions as needed as in the first example, it's important to remember that the debug module does not write anything unless that particular debugger is enabled. If your fellow developer does not know you created a debugger with the name foo, she cannot know to turn it on! Furthermore, she may create a debugger with the name foo as well, not knowing you're already using that name. For this reasons (read: discoverability), it's useful to group all such debug logging functions in one file, and export them from there:
// lib/debuggers.js
const debug = require('debug');

const init = debug('app:init');
const menu = debug('app:menu');
const db = debug('app:database');
const http = debug('app:http')

module.exports = {
  init, menu, db, http
};
NB: using ES2015 object property shorthand above
This way we can discover all available debuggers and reuse debuggers across files. For example, if we access the database in customer.js & we wish to log the query, we can import that debugger & use it there:
// models/customer.js
const debugDB = require('../lib/debuggers').db;
// ...

debugDB(`looking up user by ID: ${userid}`);
db.Customer.findById(userid)
  .tap(result => debugDB('customer lookup result', result))
  .then(processCustomer)
//.then(...)
NB: using the Bluebird promises library's tap above.
We can later use the same debugger in another file, perhaps with other debuggers as well:
// config.js
debugDB = require('../lib/debuggers').db;
debugInit = require('../lib/debuggers').init;
// ...

debugInit('configuring application...');

if(process.env !== 'DEV'){
  debugInit('env not DEV, loading configs from DB');
  debugDB('reading site config from database');
  db.Config.find()
    .tap(debugDB)
    .then(config){
      configureApp(config);
    }
}else{
  debugInit('local environment: reading config from file');
  // ...
}
Then when we're confused why the app fails on startup on our local machine, we can enable app:init (or app:*) and see the following in our console...
app:init env not DEV, loading configs from DB +1ms
...and quickly discover that a missing environment variable is what's causing our issue.
Debugging All (known) Events on an Event Emitter
Background
My goal was to run my newFeatureAdded function whenever a user created a new "feature" on the map. (This example is browser-based, but the approach works just as well with Node.js EventEmiters.)
When I started, I attached my newFeatureAdded function to editable:created:
map.on('editable:created', function(e){
  newFeatureAdded(e.layer);
});
But it wasn't firing when I expected, so I added a debug function call to see what was going on:
map.on('editable:created', function(e){
  eventDebug('editable:created', e.layer);
  newFeatureAdded(e.layer);
});
This revealed that the event was fired when the user clicked "create new feature", not when they placed the feature on the map. I fixed the issue, but I found myself adding debug function calls all over the place, with almost every event handler function:
map.on('editable:drawing:commit', function(e){
  eventDebug('FIRED: editable:drawing:commit');
  handleDrawingCommit(e);
});

map.on('click', function(e){
  eventDebug('FIRED: click');
  disableAllEdits();
});

map.on('editable:vertex:clicked', function(e){
  eventDebug('FIRED: editable:vertex:clicked');
  handleVertexClick(e);
});
This is starting to look redundant, and doubly bad as it's forcing us to wrap our handler calls in extra anonymous functions rather than delegate to them directly, i.e. map.on('click', disableEdits). Furthermore, not knowing the event system well, I want to discover other events that fire at times that might be useful to me.
Another Approach...
In order to build my UI, I needed to understand the interactions between Leaflet's 35 events and Leaflet.Editable's 18 events, which overlap, trigger one another, and have somewhat ambiguous names (layeradd, dragend, editable:drawing:dragend, editable:drawing:end, editable:drawing:commit, editable:created etc.).
We could pore over the docs and source code to find the exact event we need for each eventuality... or we could attach debug loggers to all events and see what we see!
The approach is as follows:
- Create an array of all known events
- Create a debug function for each event
- Attach that function to the target event emitter using
.on
// 1. Create list of events
const leafletEditableEvents = [
  'editable:created',
  'editable:enable',
  'editable:drawing:start',
  'editable:drawing:end',
  'editable:vertex:contextmenu',
// ...
];

const leafletEvents = [
  'click',
  'dblclick',
  'mousedown',
  'dragend',
  'layeradd',
  'layerremove',
// ...
];
Because we want to be able to use our event debugging tool on any event emitter, we'll make a function that takes the target object and events array as arguments:
function debugEvents(target, events){
  events
    // 2. Create debug function for each
    // (but keep the function name as well! we'll need it below)
    // return both as { name, debugger }
    .map(eventName => { return { name: eventName, debugger: debug(eventName) }; })
    // 3. Attach that function to the target
    .map(event => target.on(event.name, event.debugger));
}

debugEvents(mapObject, leafletEditableEvents);
debugEvents(mapObject, leafletEvents);
Assuming we set localStorage.debug='*' in our browser console, we will now see a debug statement in the console when any of the Leaflet.Editable events fire on the map object!
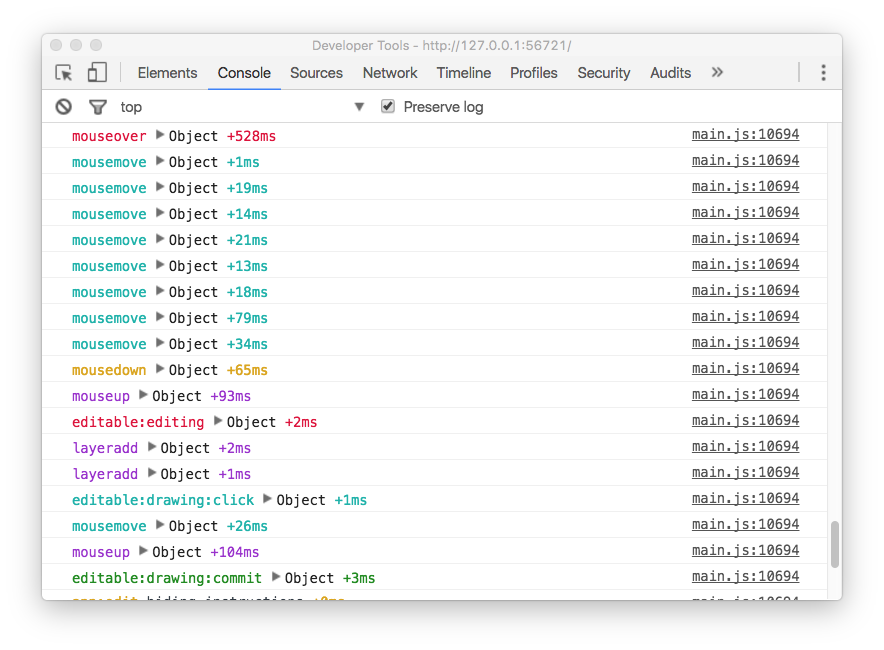
Note that whatever data is passed to an event handler attached with .on() is passed to the our debug functions. In this case it's the event object created by Leaflet, shown above in the console as ▶ Object.
mousemove etc. are not in any namespace above, and it's best to always namespace debug functions so they don't collide, to add context, and to allow enabling/disabling by namespace. Let's improve our debugEvents function to use a namespace:
function debugEvents(target, events, namespace){
  events
    .map(eventName => { return {
      name: eventName,
      debugger: debug(`${namespace}:${eventName}`)
    } } )
    .map(event => target.on(event.name, event.debugger));
}

//editable events already prefixed with "editable", so "events:editable:..."
debugEvents(mapObject, leafletEditableEvents, 'event');
//map events not prefixed so we'll add `map`, so they're "events:map:..."
debugEvents(mapObject, leafletEvents, 'event:map');
We can enable all event debuggers in our console, or just editable events, or just core map events, thus:
> localStorage.debug = 'event:*'
> localStorage.debug = 'event:editable:*'
> localStorage.debug = 'event:map:*'
Conveniently, the Leaflet.Editable events are all already "namespaced" & colon separated, just like our debug namespaces!
> localStorage.debug = 'event:editable:*' //enable all editable
> localStorage.debug = 'event:editable:drawing:*'  //just editable:drawing events
Fine Tuning the output
Let's enable all event debuggers and see what some interactions look like...
Looks nice, but the mousemove events are coming so fast they push everything else out of the console, i.e. they are noise. Some trial and error taught me it that drag events are equally noisy and that I don't need to know the core map events most of the time, just the editable events.
With this info we can tune our logging down to just what we need, enabling only editable: events & ignoring all drag & mousemove events:
> localStorage.debug = 'event:editable:*,-event:*:drag,-event:*:mousemove'
Looks good!
Conclusion
While debug is a very small & easy-to-get-started-with module, it can tuned in very granular ways and is a powerful development tool. By attaching debug statements to all events, outside of our application code, we can trace the path of an event system & better understand how events interact, without adding any debug statments into our application code. If you've found another novel use of this library or have any questions about my post, let me know. Happy logging!
NB: I use the term "debugger function" and "debug logging" rather than "debugger" and "debugging" in this post advisedly. A "debugger" typically refers to a tool that can be used to pause execution & alter the code at runtime, for example the VSCode debugger. What we're doing here is "logging."
📝 Comments? Please email them to sequoiam (at) protonmail.com