Interactive Debugging with Node.js
Originally published at StrongBlogA "step through debugger" is a powerful tool that is very handy when your application isn't behaving the way you expect it to. A step through debugger (a.k.a. "interactive debugger" or just "debugger") allows you to pause code execution in your application in order to:
- inspect or alter application state
- see the code execution path ("call stack") that lead to the currently executing line of code, and
- inspect the application state at earlier points on that path
Interactive Debuggers* are familiar to every Java developer (among others), but they are much less well known in the JavaScript world. This is unfortunate, both because debuggers can be so helpful in diagnosing logic issues, and because the debugging tools in JavaScript today are the best & easiest to use they've ever been! This post will introduce the Node.js debugging tools in VS Code in a way that's accessible to programmers who have never used a debugger before.
Why Use a Debugger?
Debuggers are useful when writing your own, original code, but they really show their value when you're working with an unfamiliar codebase. Being able to step through the code execution line by line and function by function can save hours of poring over source code, trying to step through it in your head.
The ability to change the value of a variable at runtime allows you to play through different scenarios without hardcoding values or restarting your application. Conditional breakpoints let you halt execution upon encountering an error to figure out how you got there. Even if using a debugger isn't part of your everyday process, knowing how they work adds a powerful tool to your toolbox!
Setting Up
We'll be using VS Code, which has built-in Node.js debugging capabilities. In order to run code in the context of the VS Code debugger, we must first make VS Code aware of our Node.js project. For this demo I'll create a simple express app with express-generator, you can follow along by running the commands below:
$ npm install express-generator -g
$ express test-app   # create an application
$ cd test-app
$ npm install
$ code .             # start VS Code
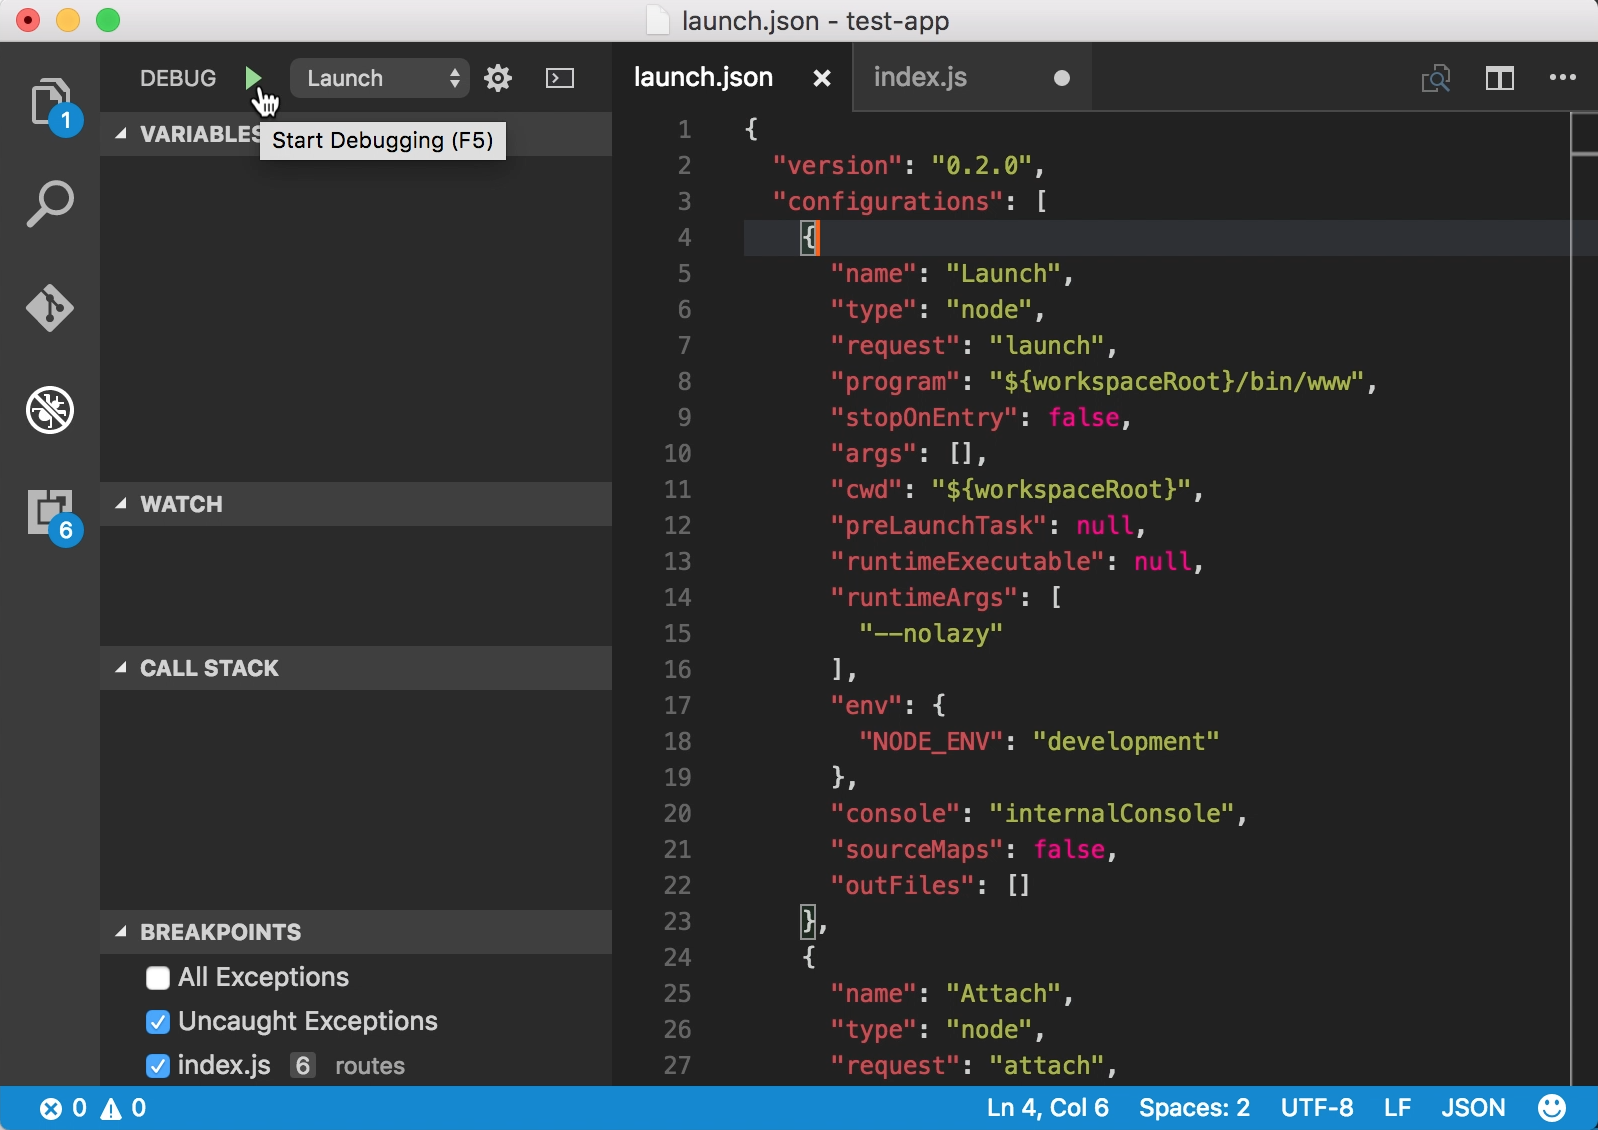
With VS Code open, we need to open the Debug pane by clicking the bug icon in left sidebar menu. With the debug pane open, you may note that the gear icon at the top of the pane has a red dot over it. This is because there are currently no "launch configurations:" configuration objects which tell VS Code how to run your application. Click the gear icon, select "Node.js," and VS Code will generate a boilerplate launch configuration for you.
There are two ways to attach the VS Code debugger to your application:
- Set up a launch configuration and launch your app from within VS Code
- Start your app from the console with
node --debug-brk your-app.jsand run the "Attach" launch configuration
The first approach normally requires some setup (which is beyond the scope of this post but you can read about here), but because our package.json has a run script, VS Code automagically created a launch configuration based on that script. That means we should be able to simply click the green "run" button to start our application in the debugger.
If all went well, you should see a new toolbar at the top of your screen with pause and play buttons (among others). The Debug Console at the bottom of the screen should tell you what command it ran & what output that command yielded, something like this:
node --debug-brk=18764 --nolazy bin/www
Debugger listening on port 18764
When we load http://localhost:3000 in a browser, we can see the Express log messages in this same Debug Console:
GET / 304 327.916 ms - -
GET /stylesheets/style.css 304 1.313 ms - -
Now that we have the code running with the VS Code debugger attached, let's set some breakpoints and start stepping through our code!
Breakpoints
A breakpoint is a marker on a line of code that tells the debugger "pause execution here." To set a breakpoint in VS Code, click the gutter just to the left of the line number. I've opened routes/index.js in order to set a breakpoint in the root request listener:
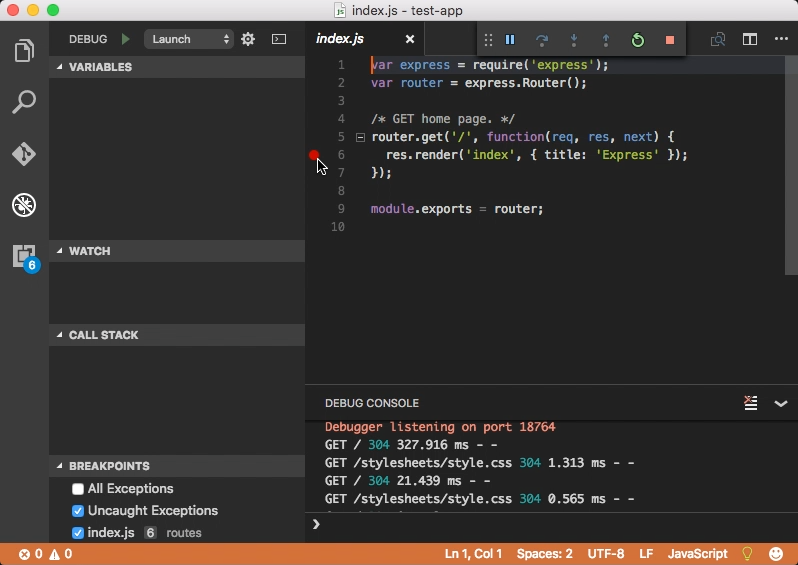
Note that the breakpoints pane at the bottom left has a listing for this new breakpoint (along with entries for exceptions, which we'll talk about momentarily). Now, when I hit http://localhost:3000 in a browser again, VS Code will pause at this point & allow me to examine what's going on a that point:
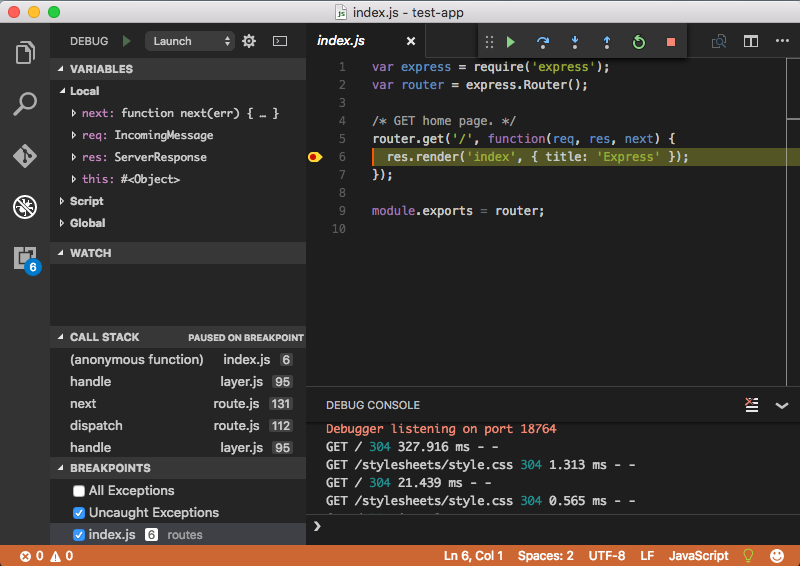
With the code paused here, we can examine variables and their values in the variables pane and see how we got to this point in the code in the call stack pane. You may also have noticed that the browser has not loaded the page-- that's because it's still waiting for our server to respond! We'll take a look at each of the sidebar panes in turn, but for now, I'll press the play button to allow code execution to continue.
Now the server should send the finished page to the browser. Note that the with code execution resumed, the "play" button is no longer enabled.
Other types of breakpoints
In addition to breaking on a certain line each time it's executed, you can add dynamic breakpoints that pause execution only in certain circumstances. Here's a few of the more useful ones:
- Conditional Breakpoint: After setting a breakpoint, right click on it & select "edit breakpoint," this will allow you to enter an expression to conditionally activate a breakpoint. For example, if you wanted to activate a breakpoint only if the user is an admin, you might add
user.role === "admin"to your conditional breakpoint. - Uncaught Exception: This is enabled by default. With this enabled, you don't have to set any breakpoints in order to locate errors, the debugger will pause on any (uncaught) exceptions.
- All Exceptions: If you have robust error handling in your application, but you still want to see where errors are coming from before they're caught and handled, enable this setting. Be warned, however, that many libraries throw and catch errors internally in the normal course of their execution, so this can be pretty noisy.
Variable pane
In this pane, you can examine and change variables in the running application. Let's edit our homepage route in routes/index.js to make the title a variable:
/* GET home page. */
var ourTitle = 'Express';
router.get('/', function(req, res, next) {
  res.render('index', { title: ourTitle });
});
After editing our code, we'll need to restart the debugger so it picks up the new code. We can do this by clicking the green circle/arrow button in the top toolbar. After editing a file with a breakpoint already set and restarting the debugger (as we just did), you'll also want to check that your breakpoints are still in the right spot. VS Code does a pretty good job of keeping the breakpoint on the line you expect but it's not perfect.
With our breakpoint on what's now line 7 and with the debugger restarted, let's refresh our browser. The debugger should stop on line seven. We don't see ourTitle in the variable pane right away, because it's not "Local" to that function, but expand the "Closure" section just below the "Local" section and there it is!
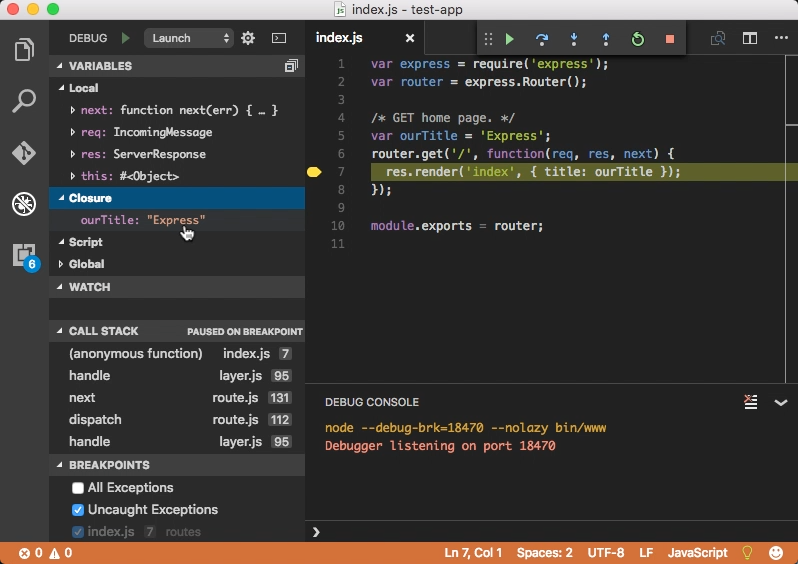
Double-clicking ourTitle in the Variables Pane allows us to edit it. This is a great way to tinker with your application and see what happens if you switch a flag from true to false, change a user's role, or do something else-- all without having to alter the actual application code or restart your application!
The variable pane is also a great way to poke around and see what's available in objects created by libraries or other code. For example, under "Local" we can see the req object, see that its type is IncomingMessage, and by expanding it we can see the originalUrl, headers, and various other properties and methods.
Stepping
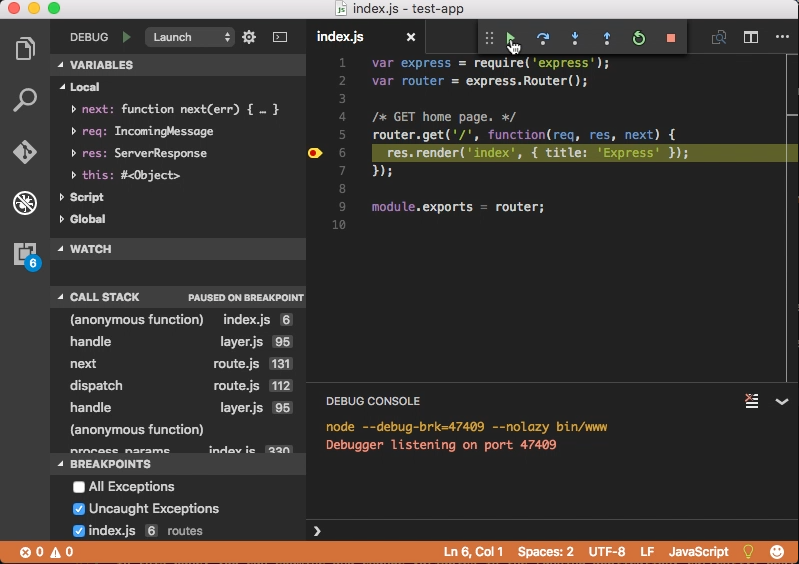
Sometimes, rather than just pausing the application, examining or altering a value, and setting it running again, you want to see what's happening in your code line by line: what function is calling which and and how that's changing the application state. This is where the "Debug Actions" menu comes in: it's the bar at the top of the screen with the playback buttons. We've used the continue (green arrow) and restart (green circle arrow) buttons so far, and you can hover over the others to see the names and associated keyboard shortcuts for each. The buttons are, from left to right:
- Continue/Pause: Resume execution (when paused) or pause execution.
- Step over: Execute the current line and move to the next line. Use this button to step through a file line by line.
- Step in: When paused on a function call, you can use this button to step into that function. This can get a bit confusing if there are multiple function calls on one line, so just play around with it.
- Step out: Run the current function to its
returnstatement & step out to the line of code that invoked that function. - Restart: Stop your debugging session (kill your application) and start it again from the beginning. Use this after altering code.
- Stop: Kill your application.
Watch Expressions
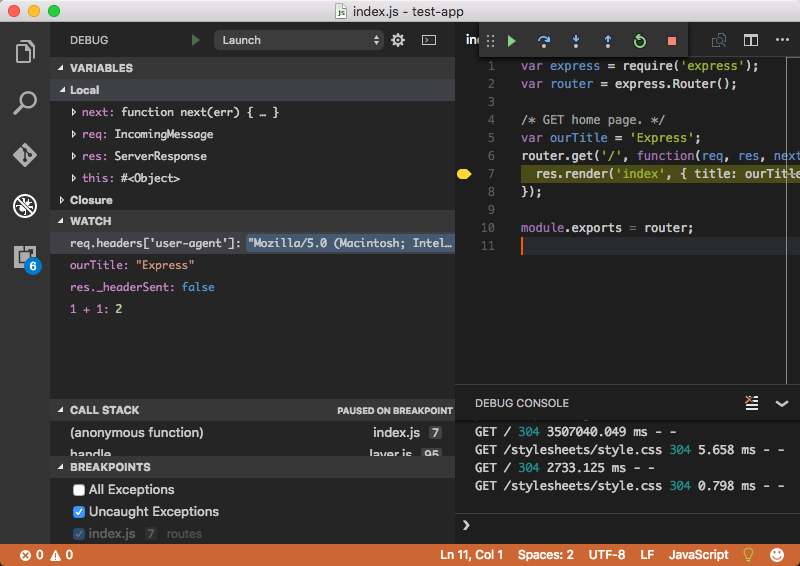
While stepping through your code, there may be certain values you always want to see the current value of. A "watch expression" will run (in the current scope!) at each paused/stopped position in your code & display the return value of that expression. Hover over the Watch Expression pane and click the plus to add an expression. I want to see the user agent header of each request as well as ourTitle, whether the response object has had headers sent, and the value of 1 + 1, just for good measure, so I'll add the following watch expressions:
req.headers['user-agent']
ourTitle
res._headerSent
1 + 1
When I refresh the browser the debugger pauses once again at the breakpoint on line 7 and we can see the result of each expression:
Call Stack
The Call Stack Pane shows us the function calls that got us to the current position in the code when execution is paused, and allow us to step back up that stack and examine the application state in earlier "frames." By clicking the frame below the current frame you can jump to the code that called the current function. In our case, the current frame is labeled (anonymous function) in index.js [7], and the one before that the handle function in layer.js, which is a component of the Express framework:
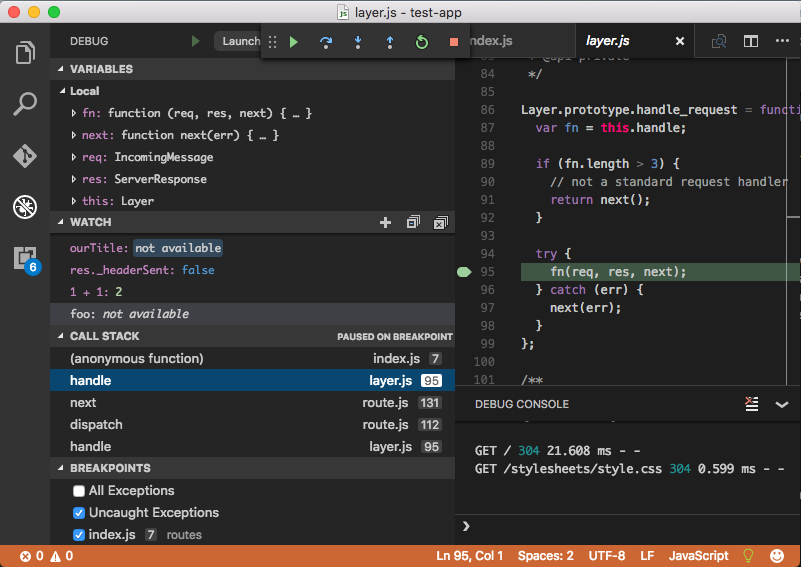
Note that the request handling function is unnamed, hence "(anonymous function)." "Anonymous function?!" What's that? Who knows! Moral: always name your functions!
Stepping down into the Express framework is not something I do every day, but when you absolutely need to understand how you got to where you are, the Call Stack Pane is very useful!
One especially interesting use of the Call Stack Pane is to examine variables at earlier points in your code's execution. By clicking up through the stack, you can see what variables those earlier functions had in their scope, as well as see the state of any global variables at that point in execution.
All This and More...
There are many more features of the interactive debugger than I went over here, but this is enough to get you started. If you want to learn more, take a look at the excellent documentation from Microsoft on the VS Code Debugger and using it with Node.js. Oh, and I should probably mention that all the debugging features outlined here (and more) are built-in to Firefox as well as Chrome, should you wish to use them on browser-based code. Happy Debugging!
* There's no specific term I've found for this common collection of application debugging tools so I'm using the term "interactive debugging" in this article.
📝 Comments? Please email them to sequoiam (at) protonmail.com